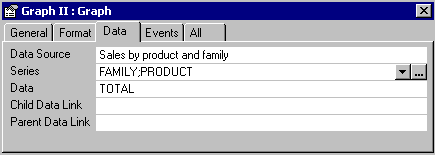
Selecting several columns for the X axis for a graph
When inserting a graph in a ClicknDECiDE Builder report, it is sometimes necessary to select more than one column for the Series (X axis).

This is now possible via a new wizard which enables you to click the Browse ... button to select the required fields that will appear in the Series box separated by a semi-colon.

For example if 2 columns are selected for the X axis, the data in the Y axis will represent the values for each couple made with the 2 concatenated values in the X axis.
In the above picture, the TOTAL will be displayed for each couple of value FAMILY & PRODUCT.
New Feature in Version 4.10: Please note that the Wizard enables you to display all the fields in the current report in order to feed the graph directly with data from the report without needing to run an additional query. This optimizes performance. The Wizard also displays the column names of the query feeding the current report and the internal names of the current report's items which can be used for the graph. From left to right the following are displayed: the Name, Type, Origin (Report or Query) along with a description (which for the report's items is the name of the blocks including each item - Detail, Report Header, Group Header, Group Footer etc...).
Please note that you can sort the above information by clicking the column headers in the following window:
