Graph example (Page 2)

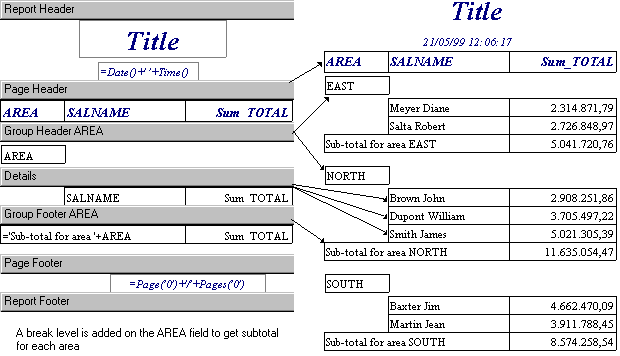
In the Report, a Break level is added on the AREA field.
The Detail block gives the total for each salesman.
The Group Footer AREA block produces automatically a sub-total by area.
From this step, the graph added to a report can either be fed by a query or by data from the current report. This avoids running the query twice (this feature is available from version 4.10 onwards).
Continue with this example by either:
Feeding a graph with data from the current report