Example of graph fed by a report (Page 5)
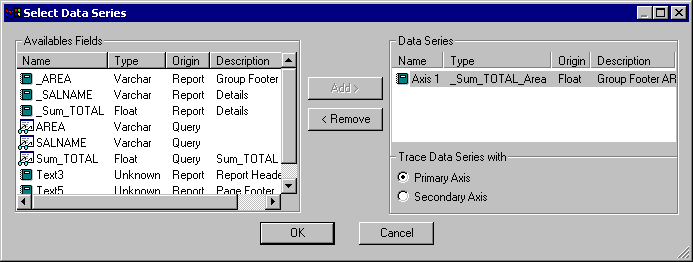
In the same way, a graph fed by data from a zone of each break level can be added in the same report, in the report footer block. To do so, add a graph in the break footer and feed it as follows:

Region: the « _AREA » report zone is used to retrieve the name of the region in the Group Footer block in the break on the AREA field. (See Series)

Total: the « _Sum_Total_Area » report zone is used to retrieve the Sum_Total_Area field from the Group Footer block in the break on the AREA field (See Data)

Run the report: the last page displays the following graph, with data from each break (region and total by region):
