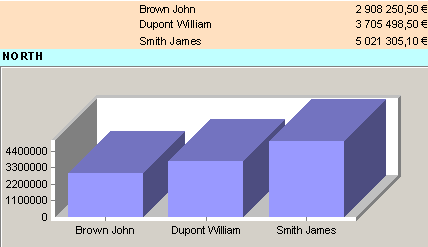
Example of graph fed by a report (Page 4)

The picture is displayed after each break level on the Region (AREA) field, in the Region (AREA) group footer block. The data from the Detail group feed the graph for the zone concerned at each break level.
See also: Adding a graph fed by data from Report break blocks.